
A More Self-Explanatory Career Ladder
The level axis now names and explains every level on hover, so the chart reads on its own for candidates and recruiters alike.
A Claude AI skill that turns any resume PDF into a structured, visual infographic.
The skill reads the text of a resume PDF, parses it into a structured JSON (name, contact, experience, education, skills, and more), then renders the JSON as a self-contained HTML/CSS/JS infographic no external dependencies, one file, ready to share or print.
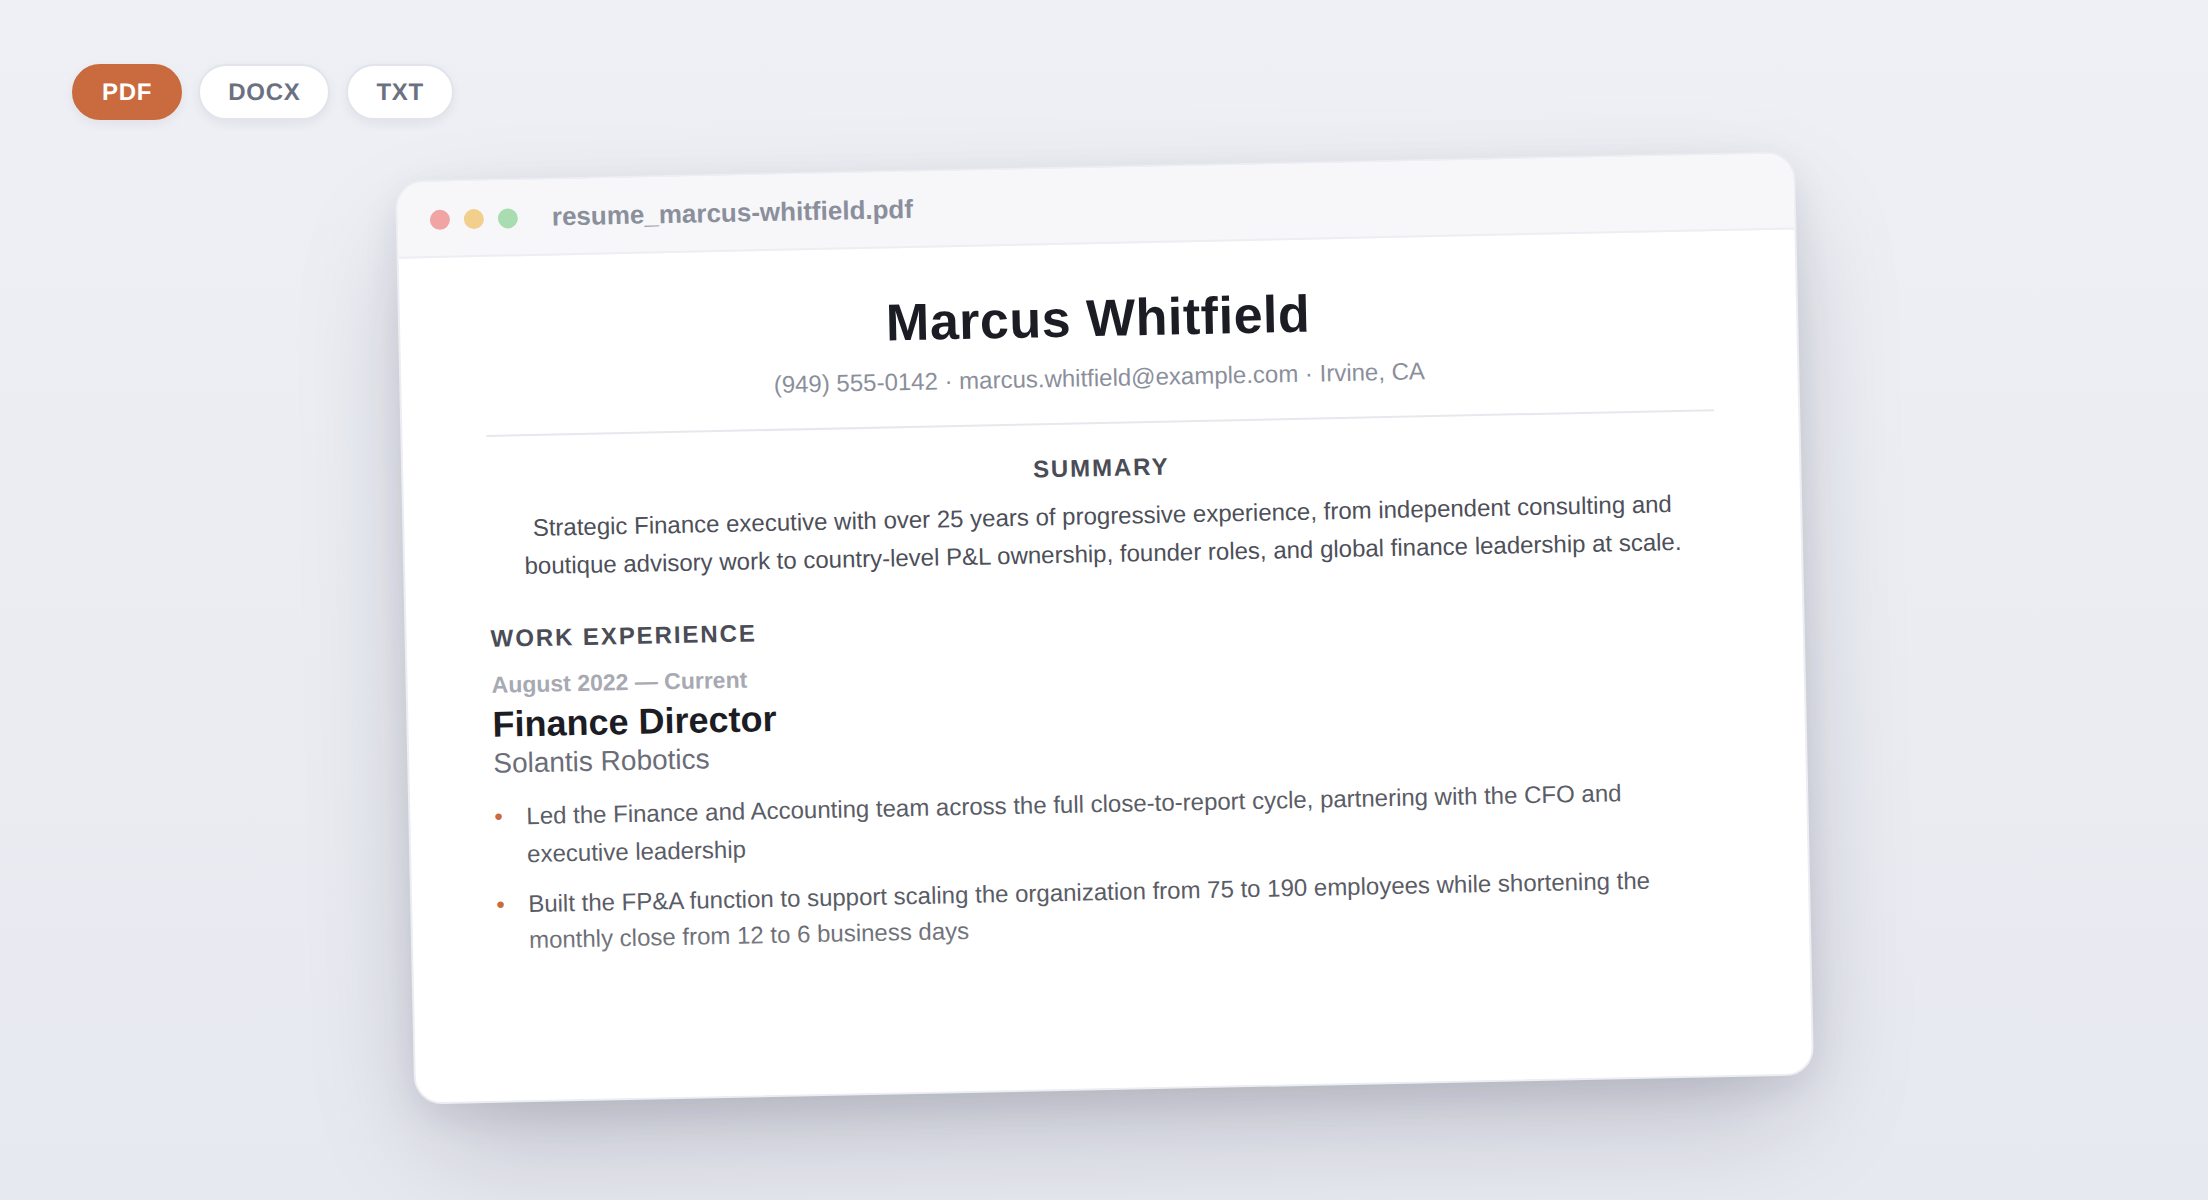

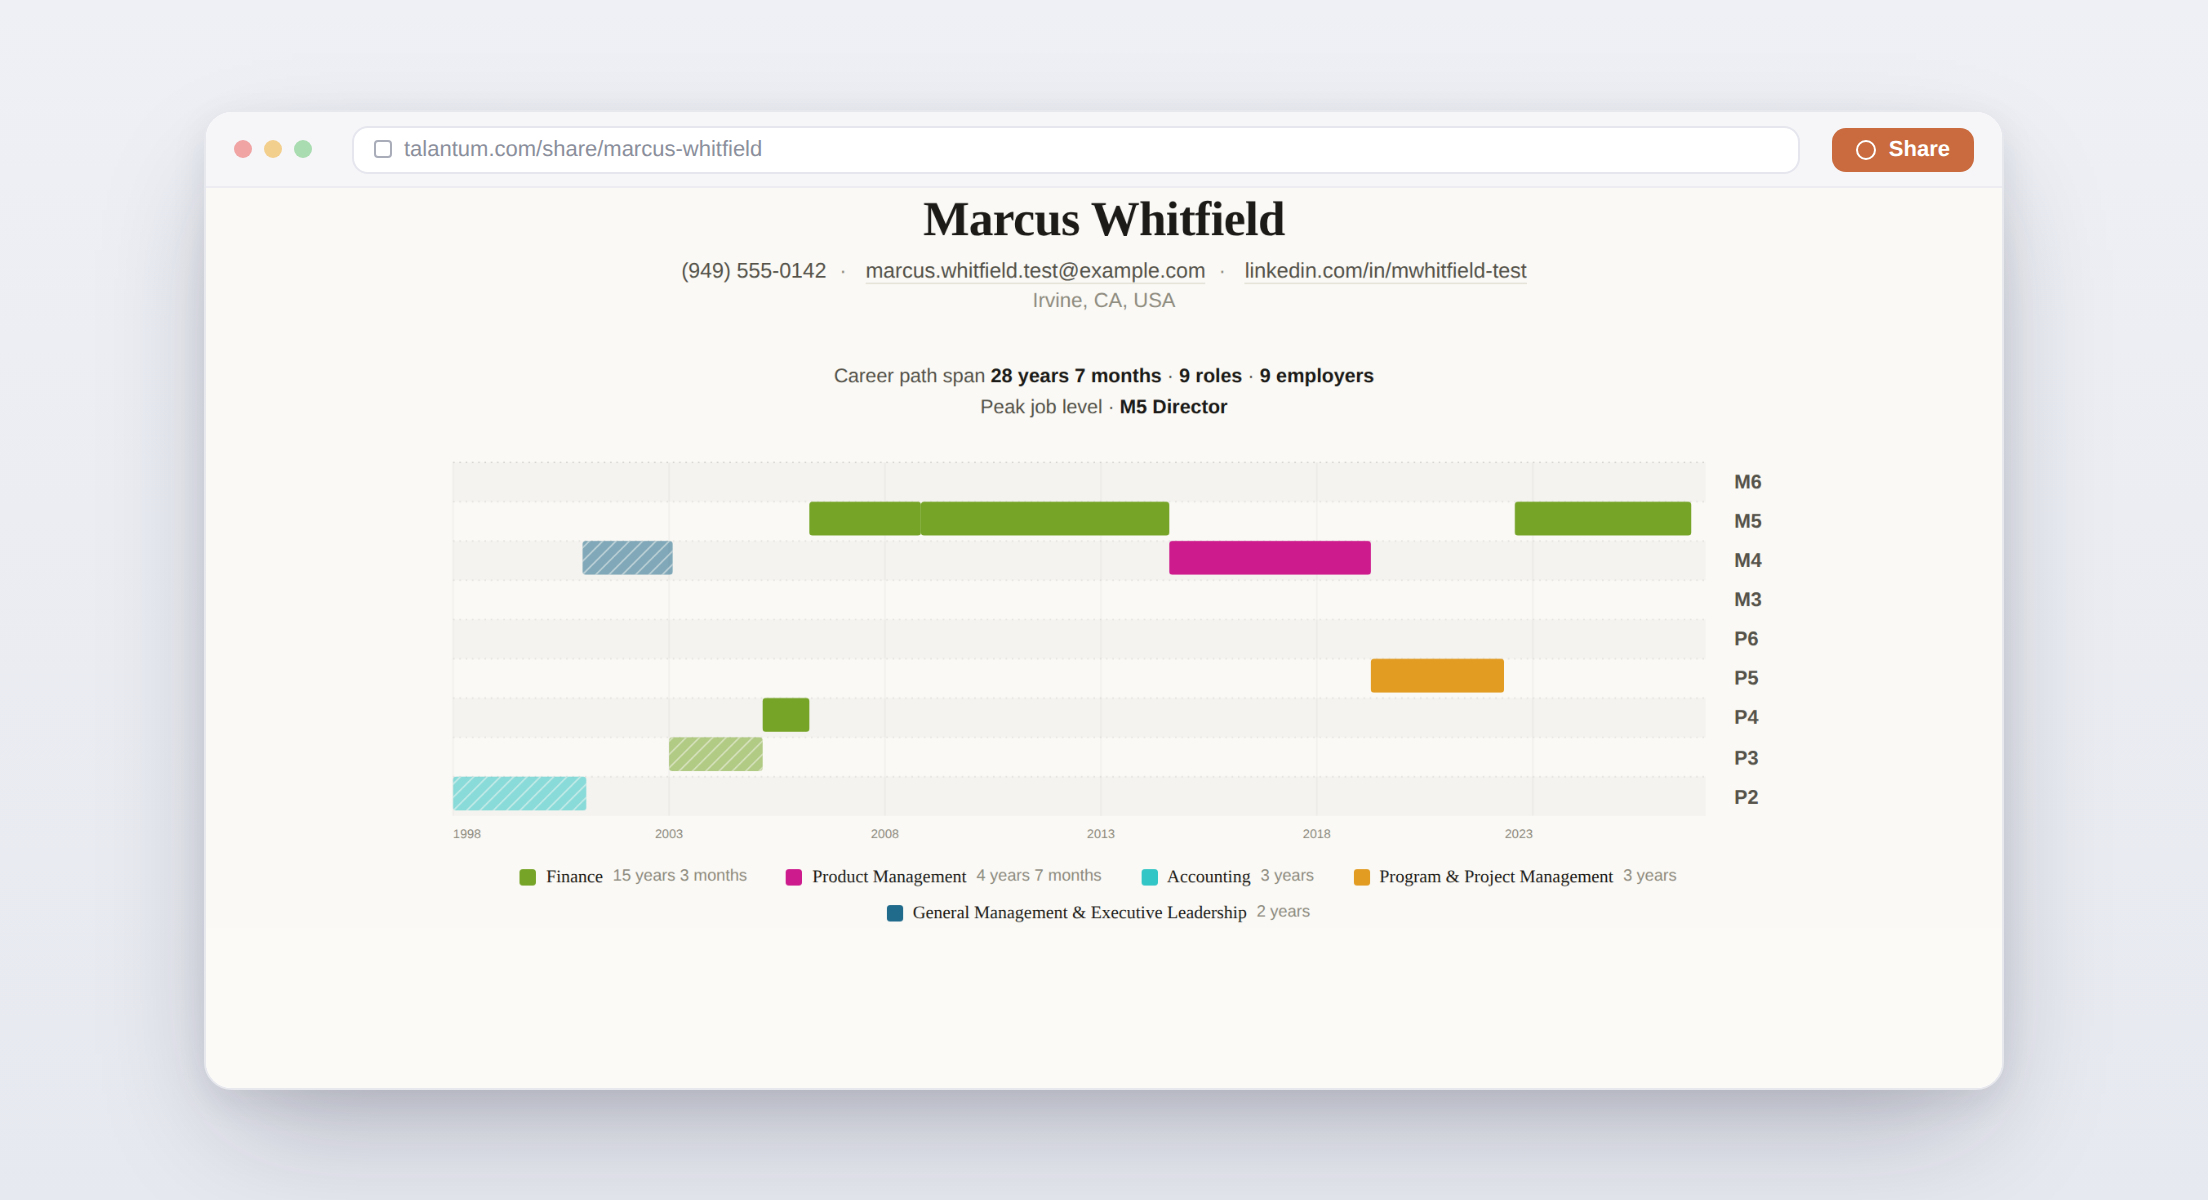
The resume-parsing-visualization skill lives in a GitHub repository, which always holds the current version and is updated as the skill improves. You can inspect the skill contents on GitHub.
To install the skill:
After the skill is installed and appears in your list of skills, prompt Claude by typing use resume visualization skill to visualize the attached resume and attaching your resume file to the chat.
Claude will output a single .html file with the visual resume.
The level axis now names and explains every level on hover, so the chart reads on its own for candidates and recruiters alike.
Version 2.0 splits parsing from rendering: fewer AI tokens, less compute per render, and roughly half the time to a finished chart.
Recruiters say visual resumes add clutter, not value, and they are partly right. Why a standardized career ladder is different, where it helps today, and where it does not yet.
TalentMap.ru turned careers into interactive infographics in 2012, then ran into a classification ceiling that no amount of product vision could get past. Here is what large language models changed.